Regional

This statistic highlights the need for better local air quality monitoring infrastructure globally, according to the paper.
Digital Desk: According to a
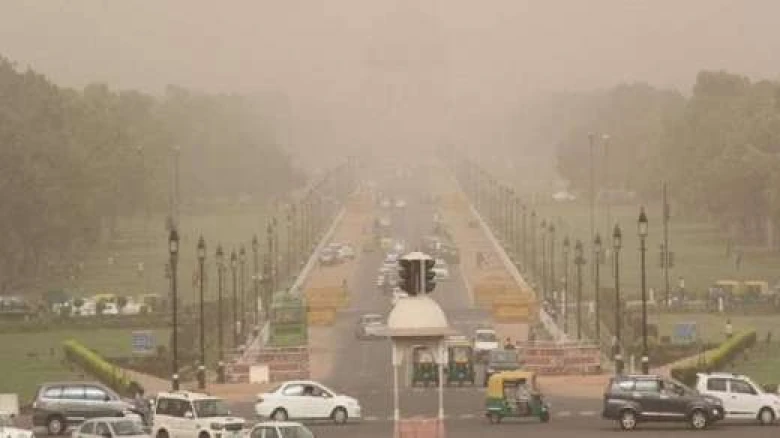
study by the Health Effects Institute's (HEI) State of Global Air Initiative, Delhi
remained the most polluted city in the world in terms of yearly average
population-weighted PM2.5 concentrations. The second most polluted city in the
world is Kolkata in West Bengal, another Indian city. Mumbai, on the other
hand, came in at number 14 on the list of most polluted cities.
According to the
initiative's report, "Air Pollution and Health in Cities," Lima,
Peru, was ranked fourth, with Kano, Nigeria, taking third place. Jakarta,
Indonesia, and Dhaka, Bangladesh, were ranked fifth and sixth, respectively. Besides
India, China’s three cities - Beijing, Shanghai, and Chengdu - are featured in the
list of the world’s top 20 polluted cities.
List of world’s top 20
polluted cities
1. Delhi
2. Kolkata
3. Kano, Nigeria
4. Lima, Peru
5. Dhaka, Bangladesh
6. Jakarta, Indonesia
7. Lagos, Nigeria
8. Karachi, Pakistan
9. Beijing, China
10. Accra, Ghana
11. Chengdu, China
12. Singapore, Singapore
13. Abijan, Cote d’Ivoire
14. Mumbai
15. Bamako, Mali
16. Shanghai, China
17. Dushanbe, Tajikistan
18. Tashkent, Uzbekistan
19. Kishasa, Democratic Republic of the Congo
20. Cairo, Egypt
There are official
ground-level air monitoring stations in 2 Indian cities.
Local information on air
quality is lacking in many cities worldwide. Only two of the 20 cities with the
greatest increases in PM2.5 exposures in our data- Satna in Madhya Pradesh and
Varanasi in Uttar Pradesh, both in India- have an official monitoring station
at ground level, according to 2022 WHO Air Quality Database. This statistic
highlights the need for better local air quality monitoring infrastructure
globally, according to the paper.
Cities' relative importance
of local and regional sources might fluctuate, contributing to local and
regional air pollution. The predominant sources of PM2.5 at any given place
frequently rely on the surrounding environment, household habits, and
industrial and agricultural activity.
Additionally, as a result of
policies, the mix and size of the contribution from different sources are
changing.
Leave A Comment